I recently stumbled across yet another statistics from my chat with my girlfriend post on /r/dataisbeautiful so today I wanted to evaluate some simple data myself. Unfortunately I’m quite far from being an actual datascientist (below you’ll see some of the first matplotlib plots I’ve ever made), so I’m going to focus a bit more on data acquisition and some very simple findings and visualizations.
Since I probably don’t have any chats quite as active as the one with my girlfriend that seemed to be the obvious choice to analyze as well. Unfortunately it’s not just one chat, but split across four different messaging platforms since the inception of our relationship ~2.5 years ago. We started out using WhatsApp, then switched to Telegram, then to iMessage and back to Telegram interspersing everything with a bit of random images and answers to those on Instagram. I’d love to turn this into a discussion on the pros and cons of various messaging platforms, but this is neiter the time nor the place. You can hit me up via Matrix (@kiliankoe:matrix.org) if you’re interested in going down that route with me.
Accessing the Data
First things first, we need to actually get our hands on the chat data. This used to be rather tricky depending on the platform, but recently you might’ve heard some stir about the GDPR. A big upside to that is that I can go around to everybody that stores data on me and my behalf and ask nicely for a machine-readable export of said data. Instagram and Telegram recently implemented export features (Telegram finally doing so just a few days ago, perfect timing). WhatsApp seems to have featured an export for single chats for quite some time, which is nice. iMessage on the other hand is a bit more tricky. The chat data wasn’t included in my downloadable copy from Apple’s privacy portal, which I assume is due to the fact that all messages are end-to-end encrypted and only accessible from my local devices. Thankfully all message data is available in ~/Library/Messages/chat.d on my Mac, which is just another normal SQLite db.
Time to fire up a Jupyter notebook and consolidate everything 🎉
I was expecting to run into a few (albeit minor) problems doing this, so it came as no surprise when WhatsApp included quite a bit of random unicode chars to stumble over in it’s exported CSV. Interestingly enough Instagram was the least problematic with a well-formatted JSON file, you just have to find the correct conversation. Same goes for Telegram, which throws all conversations into a single file, but it’s not like a 15MB file will stop us. Interestingly enough Telegram also doesn’t use UTC timestamps for the message dates, but your local timezone, so watch out and adjust accordingly. Timestamps are also an issue on the iMessage end, since they seem to be a unix timestamp accurate to nanoseconds but offset 31 years into the past. I have no clue why, but would love to know.
iMessage uses NTP timestamps, thanks to Johannes K. for telling me about that! 😊
Having worked around all those issues I aggregated data on the message date, author, text, platform and type (message, attachment, sticker, voice/video) and created one big CSV sorted chronologically containing the entirety of our digital conversation since we’ve met. 62k messages that fit nicely into 5.7MB.
What Can We Learn
I’m not all too interested in sharing exact data on our relationship, so please regard that as being a side effect. Instead I wasn’t able to find any fun writeups showing a bit of sample code as well, which is the main reason for this blog post. Unfortunately though the codesamples below are far from ideal, but the beauty of doing something like this in a Jupyter notebook is that the performance costs start to become negligible since you’re only running the current cell. Everything else that’s already been computed just stays in memory. A seriously awesome feature.
So, now that everything is cleaned up and structured nicely we can ask some questions.
Who wrote the most messages in total?
janine = [msg for msg in msgs if msg['author'] == 'janine']
kilian = [msg for msg in msgs if msg['author'] == 'kilian']

print('janine:', len(janine), len(janine) / len(msgs) * 100)
print('kilian:', len(kilian), len(kilian) / len(msgs) * 100)

# janine: 35152 56.588161432090025
# kilian: 26967 43.411838567909975
Looks like my girlfriend (her name is Janine by the way in case you couldn’t tell) takes the lead with an 8k message headstart, which accounts to 56% of all messages. Could that be due to me writing longer messages instead? 🤔
How’s the average count of words per message per person?
import re

wordcount_janine = 0
for msg in janine:
    count = len(re.findall(r'\w+', msg['text']))
    wordcount_janine += count
print('janine')
print('words total:', wordcount_janine)
print('avg words/msg:', wordcount_janine / len(janine))

wordcount_kilian = 0
for msg in kilian:
    count = len(re.findall(r'\w+', msg['text']))
    wordcount_kilian += count
print('\nkilian')
print('words total:', wordcount_kilian)
print('avg words/msg:', wordcount_kilian / len(kilian))

# janine
# words total: 216606
# avg words/msg: 6.16198224852071

# kilian
# words total: 198979
# avg words/msg: 7.378610894797345
Aha! It might not be a huge difference, but it looks like my messages are bit longer on average. That evens things out 😄
What are our most used words?
from collections import defaultdict

all_words = defaultdict(lambda: 0)
for msg in msgs:
    for word in re.findall(r'\w+', msg['text']):
        all_words[word.lower()] += 1

for word in sorted(all_words, key=all_words.get, reverse=True)[:20]:
    count = all_words[word]
    print(f'{word}: {count}')

# ich: 16674
# das: 9469
# nicht: 7650
# und: 7323
# ist: 7258
# die: 6828
# du: 5920
# aber: 5831
# auch: 5824
# dann: 4805
# so: 4707
# noch: 4611
# hab: 4445
# der: 4328
# d: 4285
# ja: 4201
# da: 3098
# wir: 2969
# in: 2930
# mal: 2901
Not the most interesting of results to be honest. Interestingly enough though the distribution looks pretty much the same if you go by person, so I’m willing to believe that this might be a relatively normal distribution for most German speakers. The “d” by the way is probably part of “:D” which the regex just found as being it’s own word. Oh well ¯\_(ツ)_/¯
A much better query here would probably be to see which words are specific (or at least more specific) to one person instead of the other. I’m not quite sure how to go about doing that though 🙈
How many messages are sent per day and how many days are there without any messages at all?
all_days = set()
for msg in msgs:
    date = msg['date'].strftime('%Y-%m-%d')
    all_days.add(date)

print(len(all_days))

current_day_count = 997 # days we've been together as of today
print(len(all_days) / current_day_count * 100)

print('messages per day:', len(msgs) / len(all_days))

# 959
# 96.18856569709128
# messages per day: 64.77476538060479
Looks like there’s been 38 days without any messages, which comes to down to around 4% of all 997 days. On average there’s 64.8 messages a day over the entire timespan. Splitting this up into a running average would probably make a lot of sense.
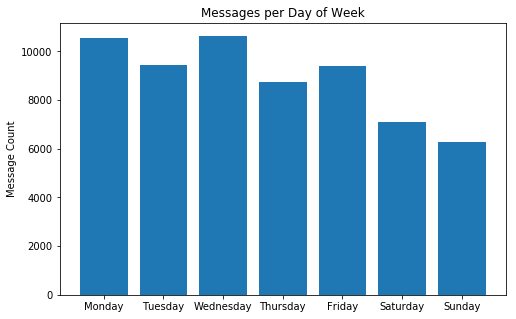
How many messages are sent per weekday?
This might actually be a good usecase to try and plot something instead. Visualizing these numbers helps put everything into a bit more perspective.
day_of_week = defaultdict(lambda: 0)
for msg in msgs:
    day = msg['date'].strftime('%A')
    day_of_week[day] += 1

xs = ['Monday', 'Tuesday', 'Wednesday', 'Thursday', 'Friday', 'Saturday', 'Sunday']
ys = [day_of_week[d] for d in xs]

plt.figure(figsize=(8,5))
plt.bar(xs, ys)
plt.title('Messages per Day of Week')
plt.ylabel('Message Count')
plt.xscale
plt.show()

Also not a surprise, since we usually spend a lot more time together on weekends making digital conversation obsolete.
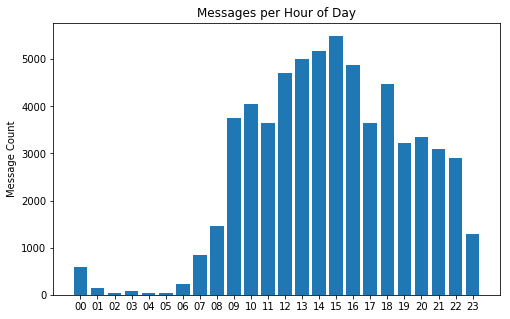
What about hours of the day instead?
hour_of_day = defaultdict(lambda: 0)
for msg in msgs:
    hour = msg['date'].strftime('%H')
    hour_of_day[hour] += 1

xs = sorted(hour_of_day.keys())
ys = [hour_of_day[h] for h in xs]

plt.figure(figsize=(8,5))
plt.bar(xs, ys)
plt.title('Messages per Hour of Day')
plt.ylabel('Message Count')
plt.show()

To be honest I’m quite surprised that there’s any messages at all between 3 and 6am 🙈 I’ve got no clue how that ever happenend 😄
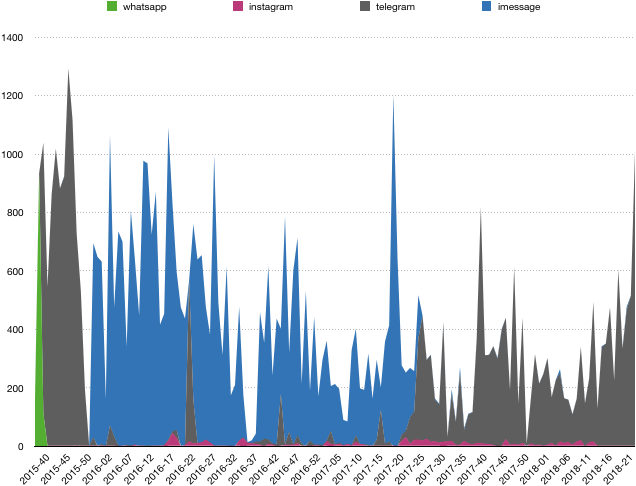
What about overall activity?
I had no clue how to go about plotting this via matplotlib, so I decided to export the data as a CSV instead of use Apple’s Numbers, please don’t judge me 😅
Different platforms have different colors and it’s overall grouped by week, not single days, which was far too noisy.
messages_per_date = defaultdict(lambda: {
    'whatsapp': 0,
    'instagram': 0,
    'telegram': 0,
    'imessage': 0
})

for msg in msgs:
    date = msg['date'].strftime('%Y-%U')
    platform = msg['platform']
    messages_per_date[date][platform] += 1

with open('activity_platforms_week.csv', 'w') as file:
    w = csv.writer(file, delimiter=',')
    w.writerow(['date', 'whatsapp', 'instagram', 'telegram', 'imessage'])
    for week in sorted(messages_per_date):
        whatsapp = messages_per_date[week]['whatsapp']
        instagram = messages_per_date[week]['instagram']
        telegram = messages_per_date[week]['telegram']
        imessage = messages_per_date[week]['imessage']
        w.writerow([week, whatsapp, instagram, telegram, imessage])

Conclusion
Pulling some stats from chats can be a lot of fun! This is also just scratching the surface, there’s a lot left to explore. I didn’t try and pull any conclusions from the gathered information, but I know that a lot can be gathered from this, and we’re basically just accessing the metadata, which each platform has access to, no matter if the data is end-to-end encrypted or not.
It might also be super interesting to use sentiment analysis to gain more insight into the nature of messages, maybe not explicitly for these shown here, but other chats as well. Or maybe just something as simple as our most used emoji 😜